Findings
"Researching and compiling all this data takes months and by that time markets can shift unexpectedly"
"Charts are difficult to make by hand"
"We should be able to export data for reports and portability"
Working with analysts by interviewing them and finding out integral pain points, we started creating a basic user flow on how analysts would view the data. A good portion of the application was automated in the background, scraping data and then feeding these results into data visualization scripts to generate charts and graphs. This required collaboration with stakeholders, project managers, and engineering to get the correct mix and create a seamless application.
User Flow
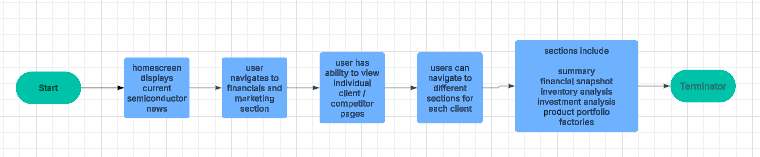
When interviewing stakeholders an interesting problem came up. For a long time, they found it difficult to compare data from one company to another. We determined that a grid would be the best way for us to display that data, where factors such as sales, gross margin, r&d expenditure, and others could be compared. We allowed users to select the companies they wished to compare to each other, up to five, further allowing for custom analytics.
Wireframes
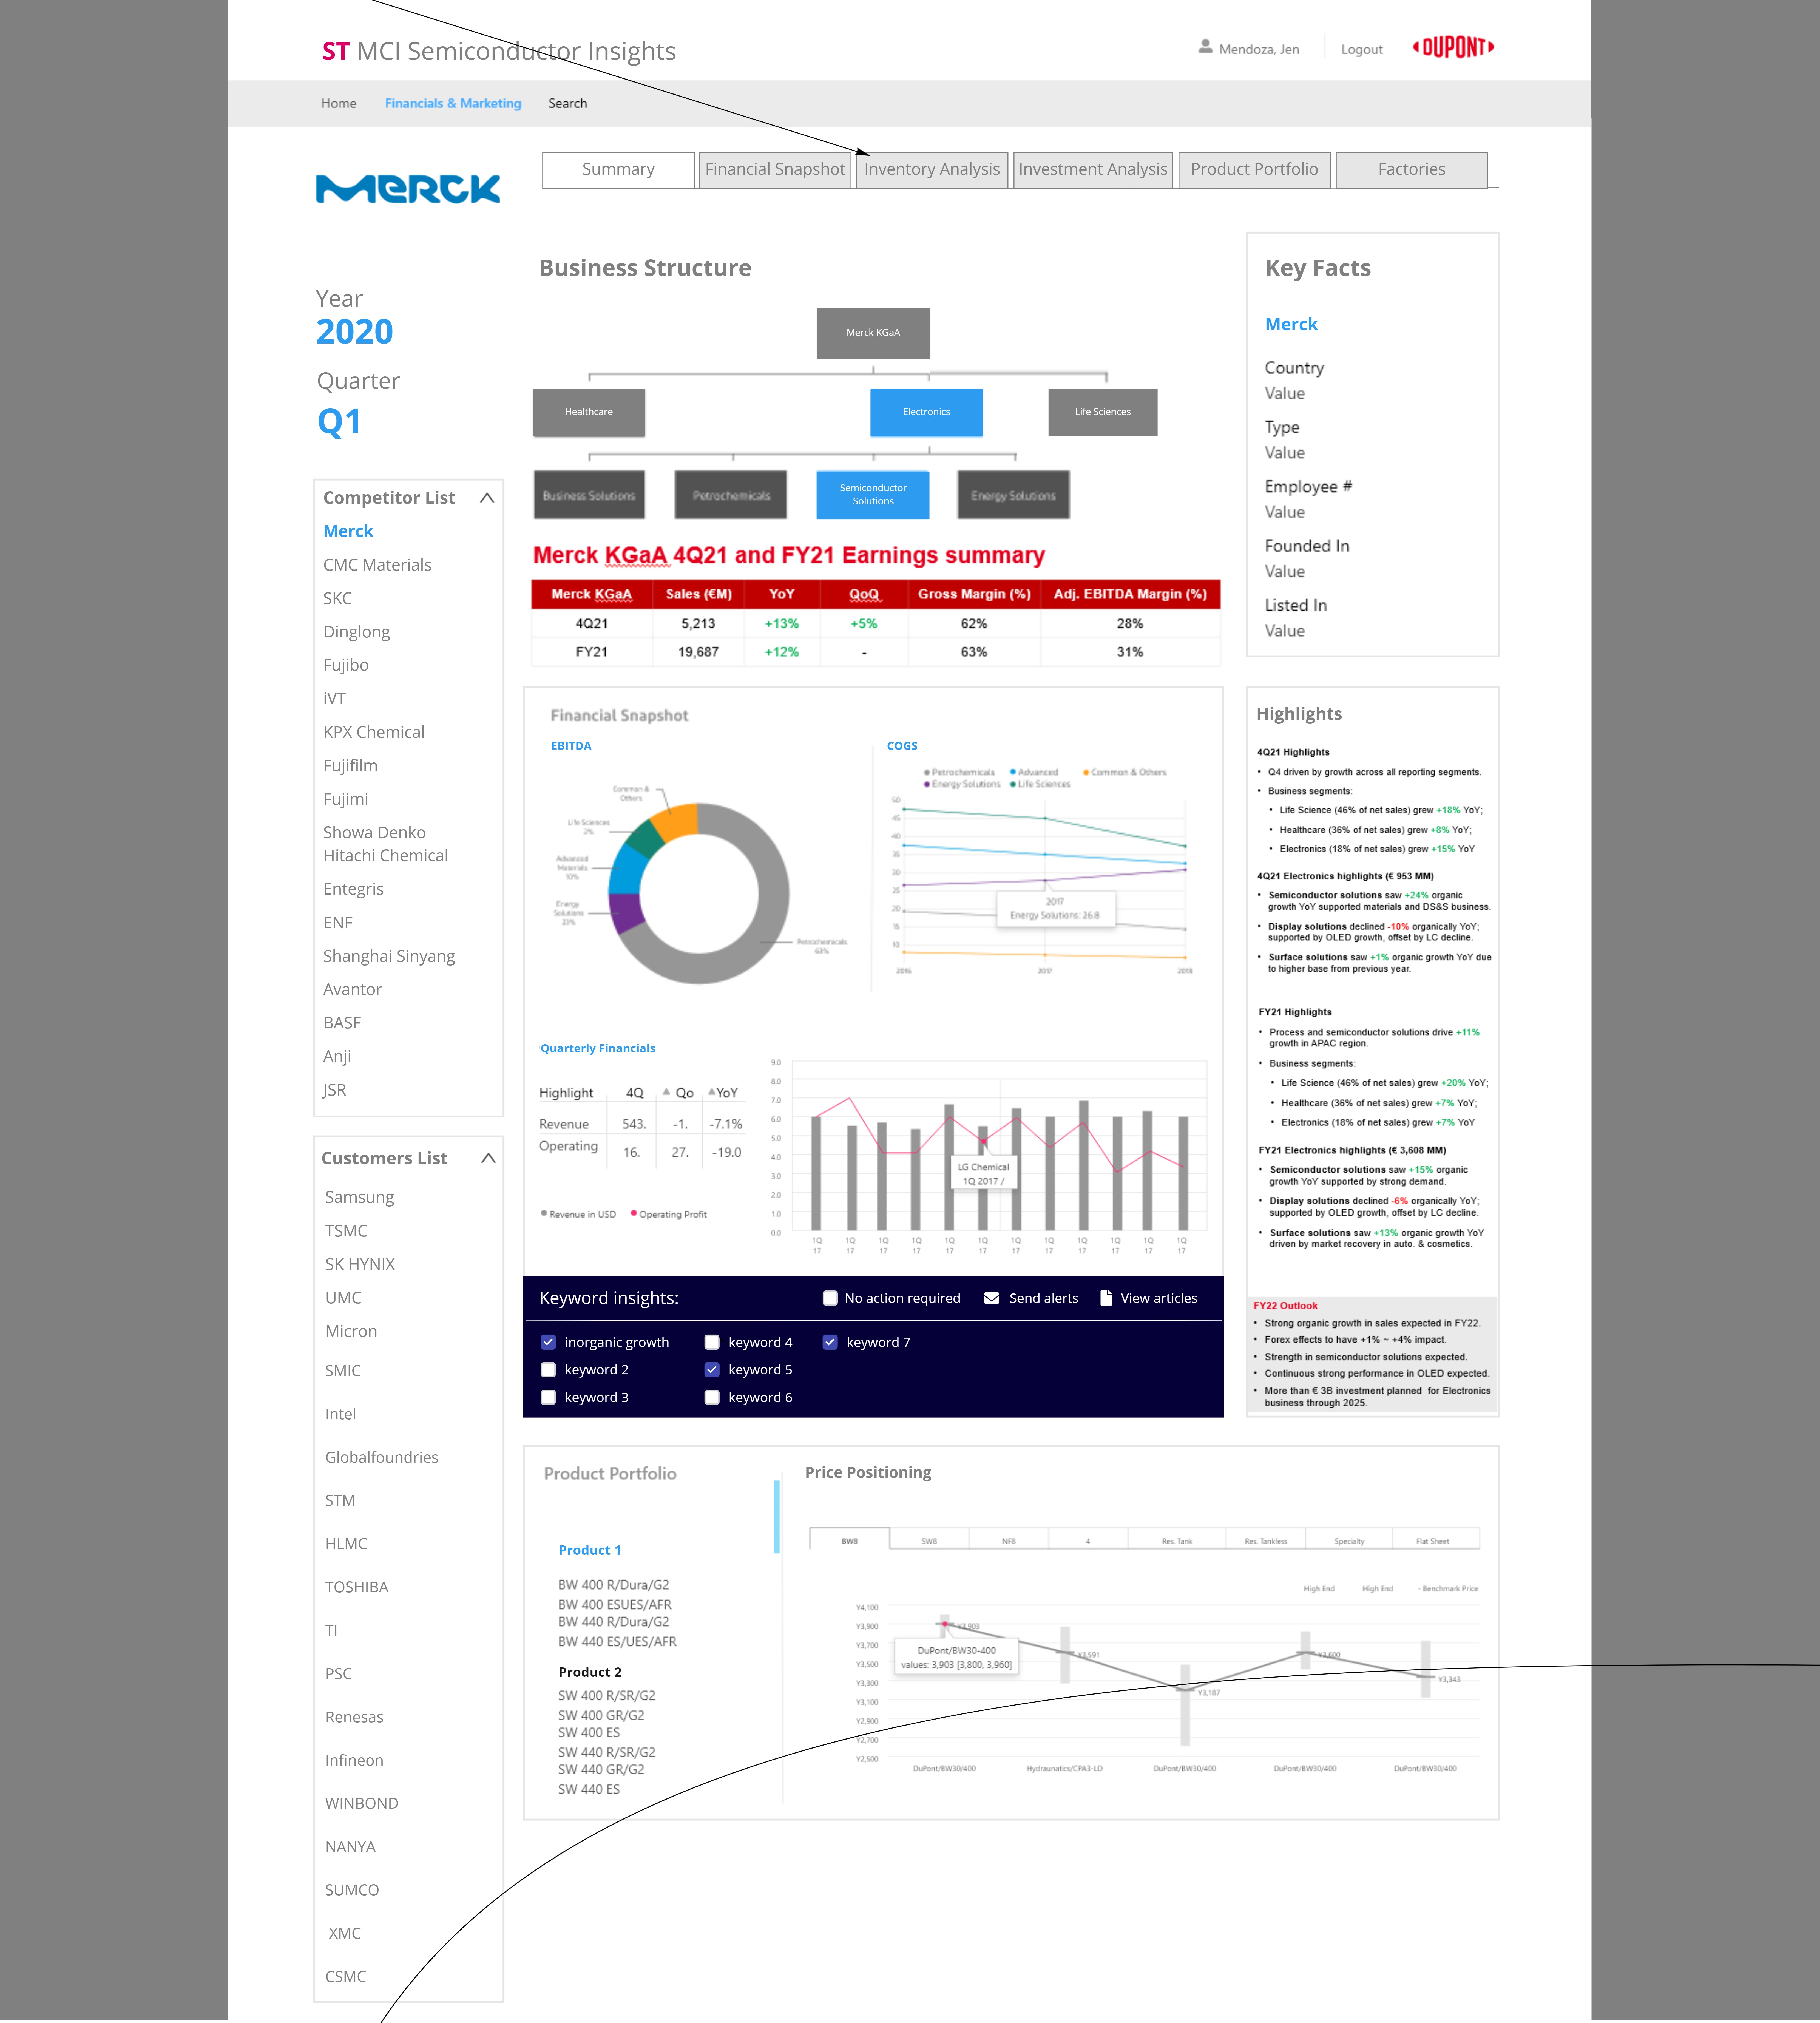
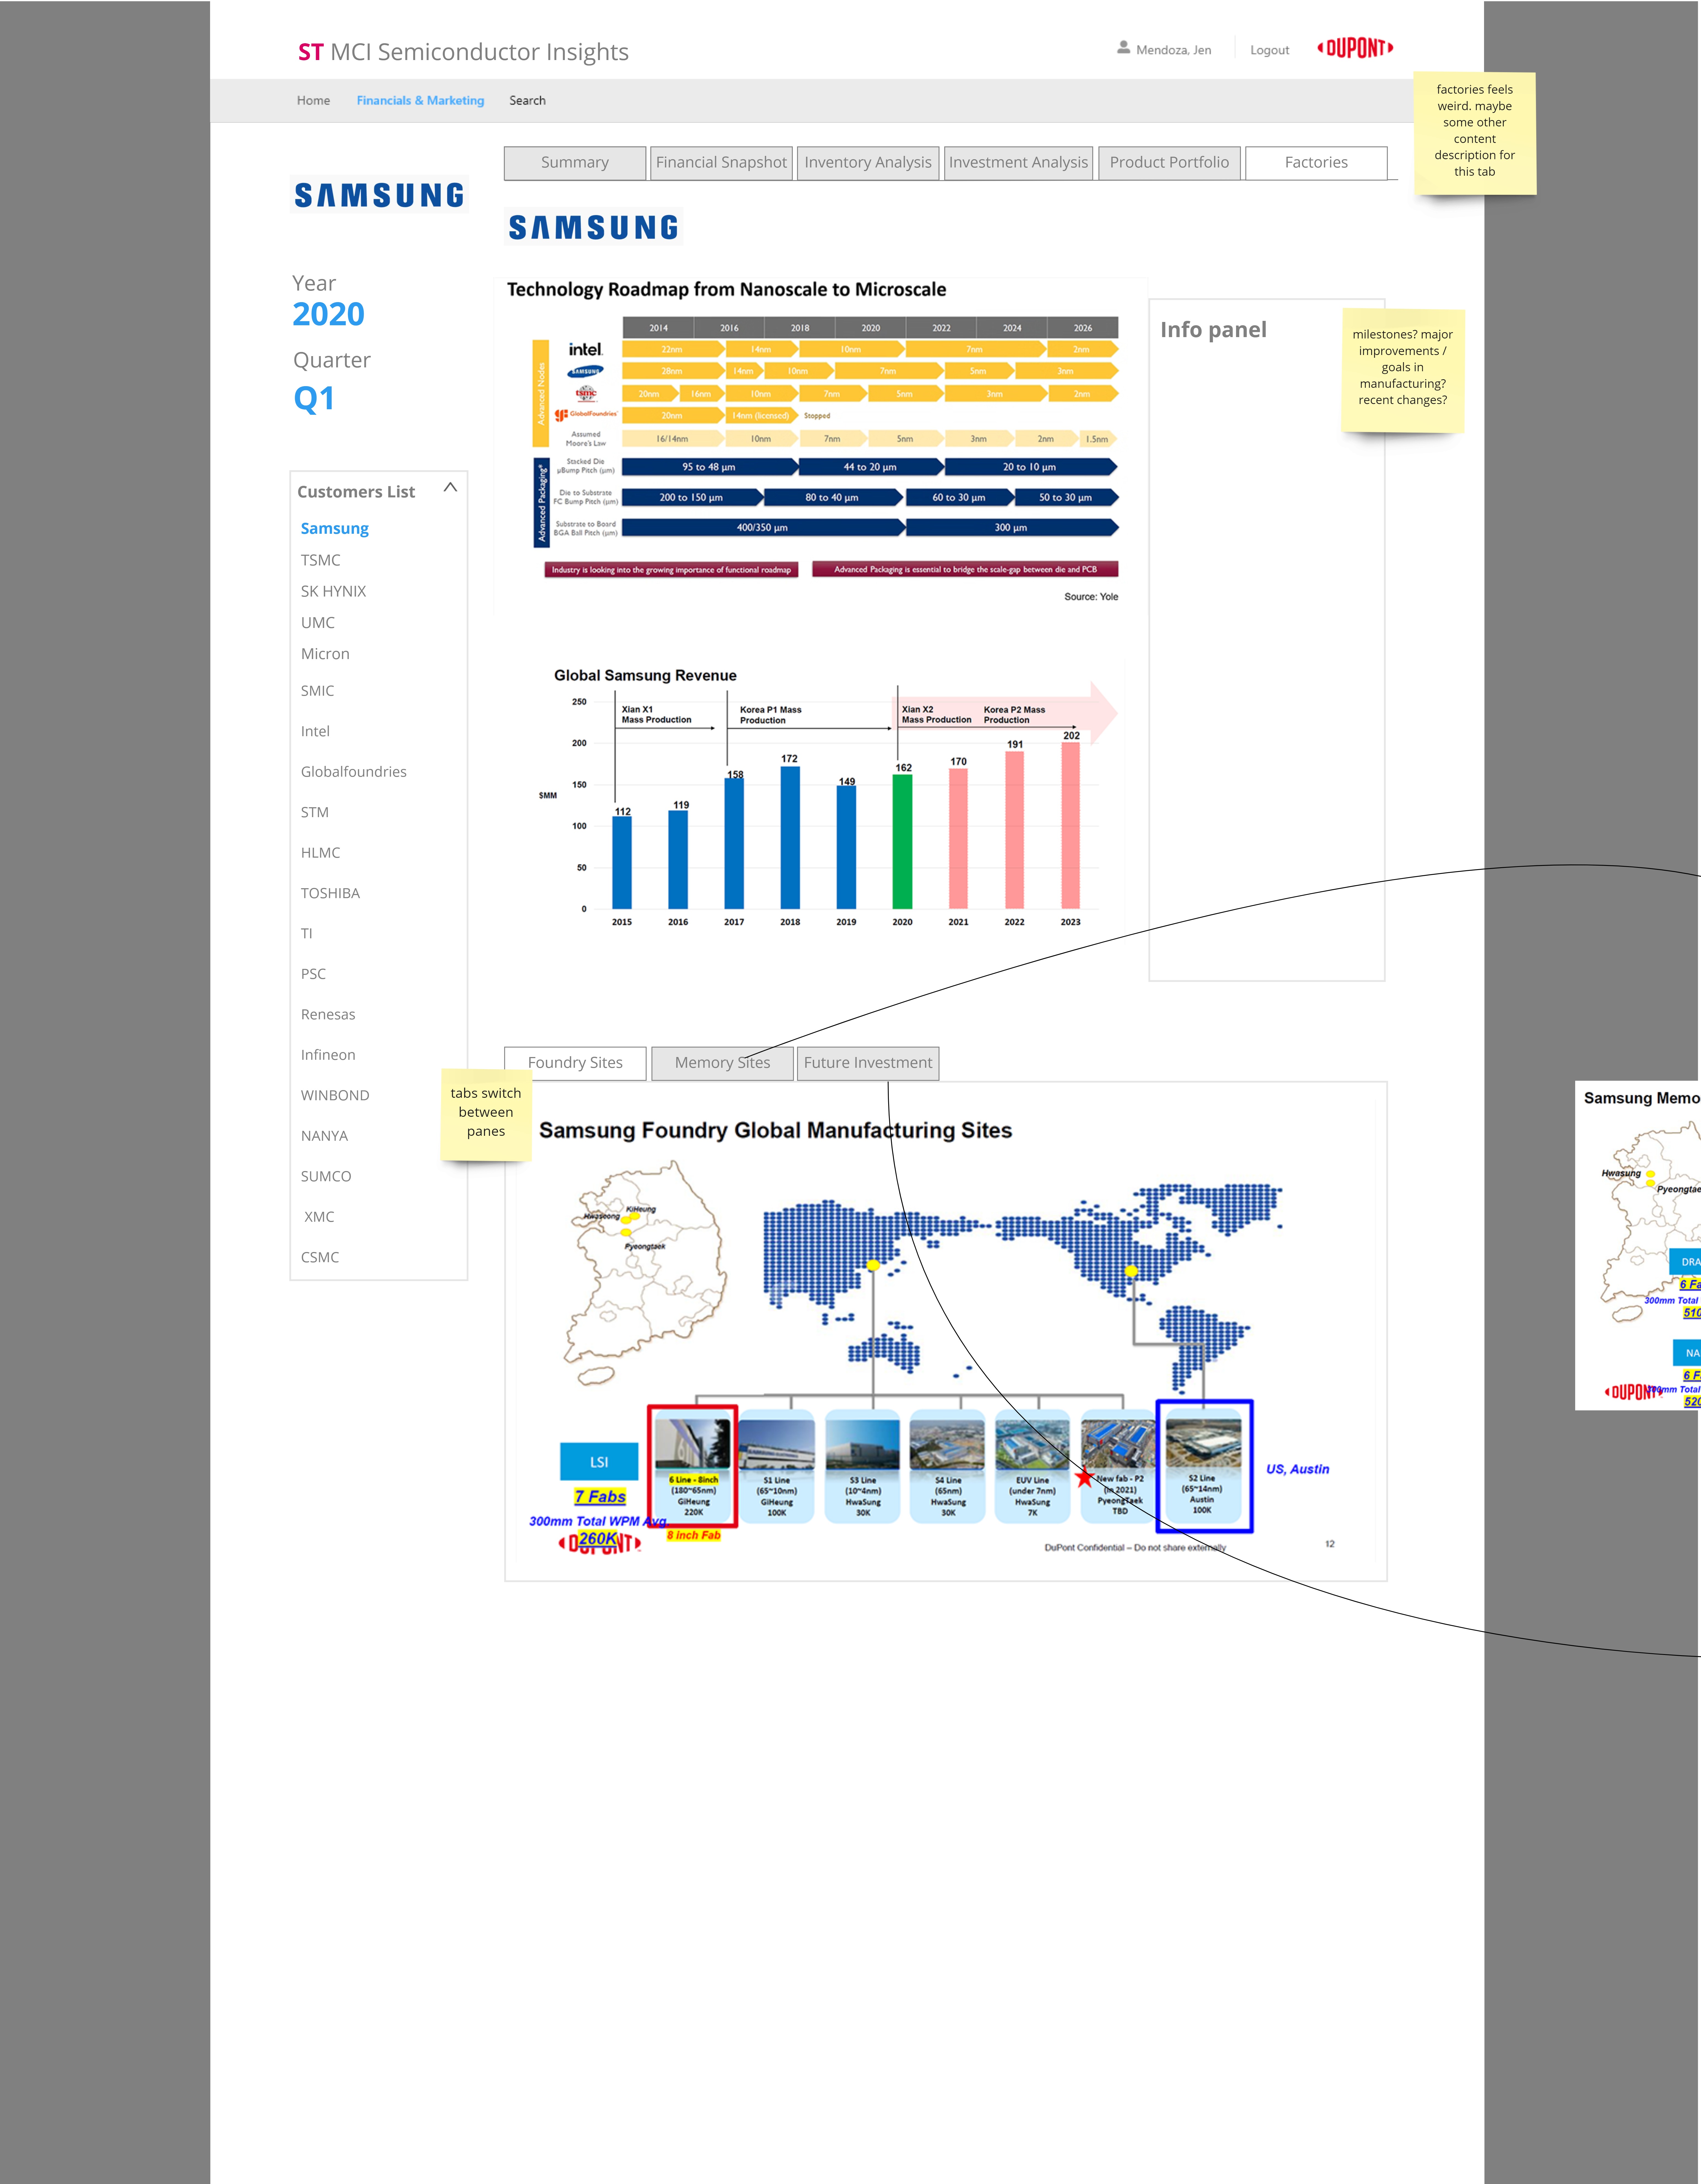
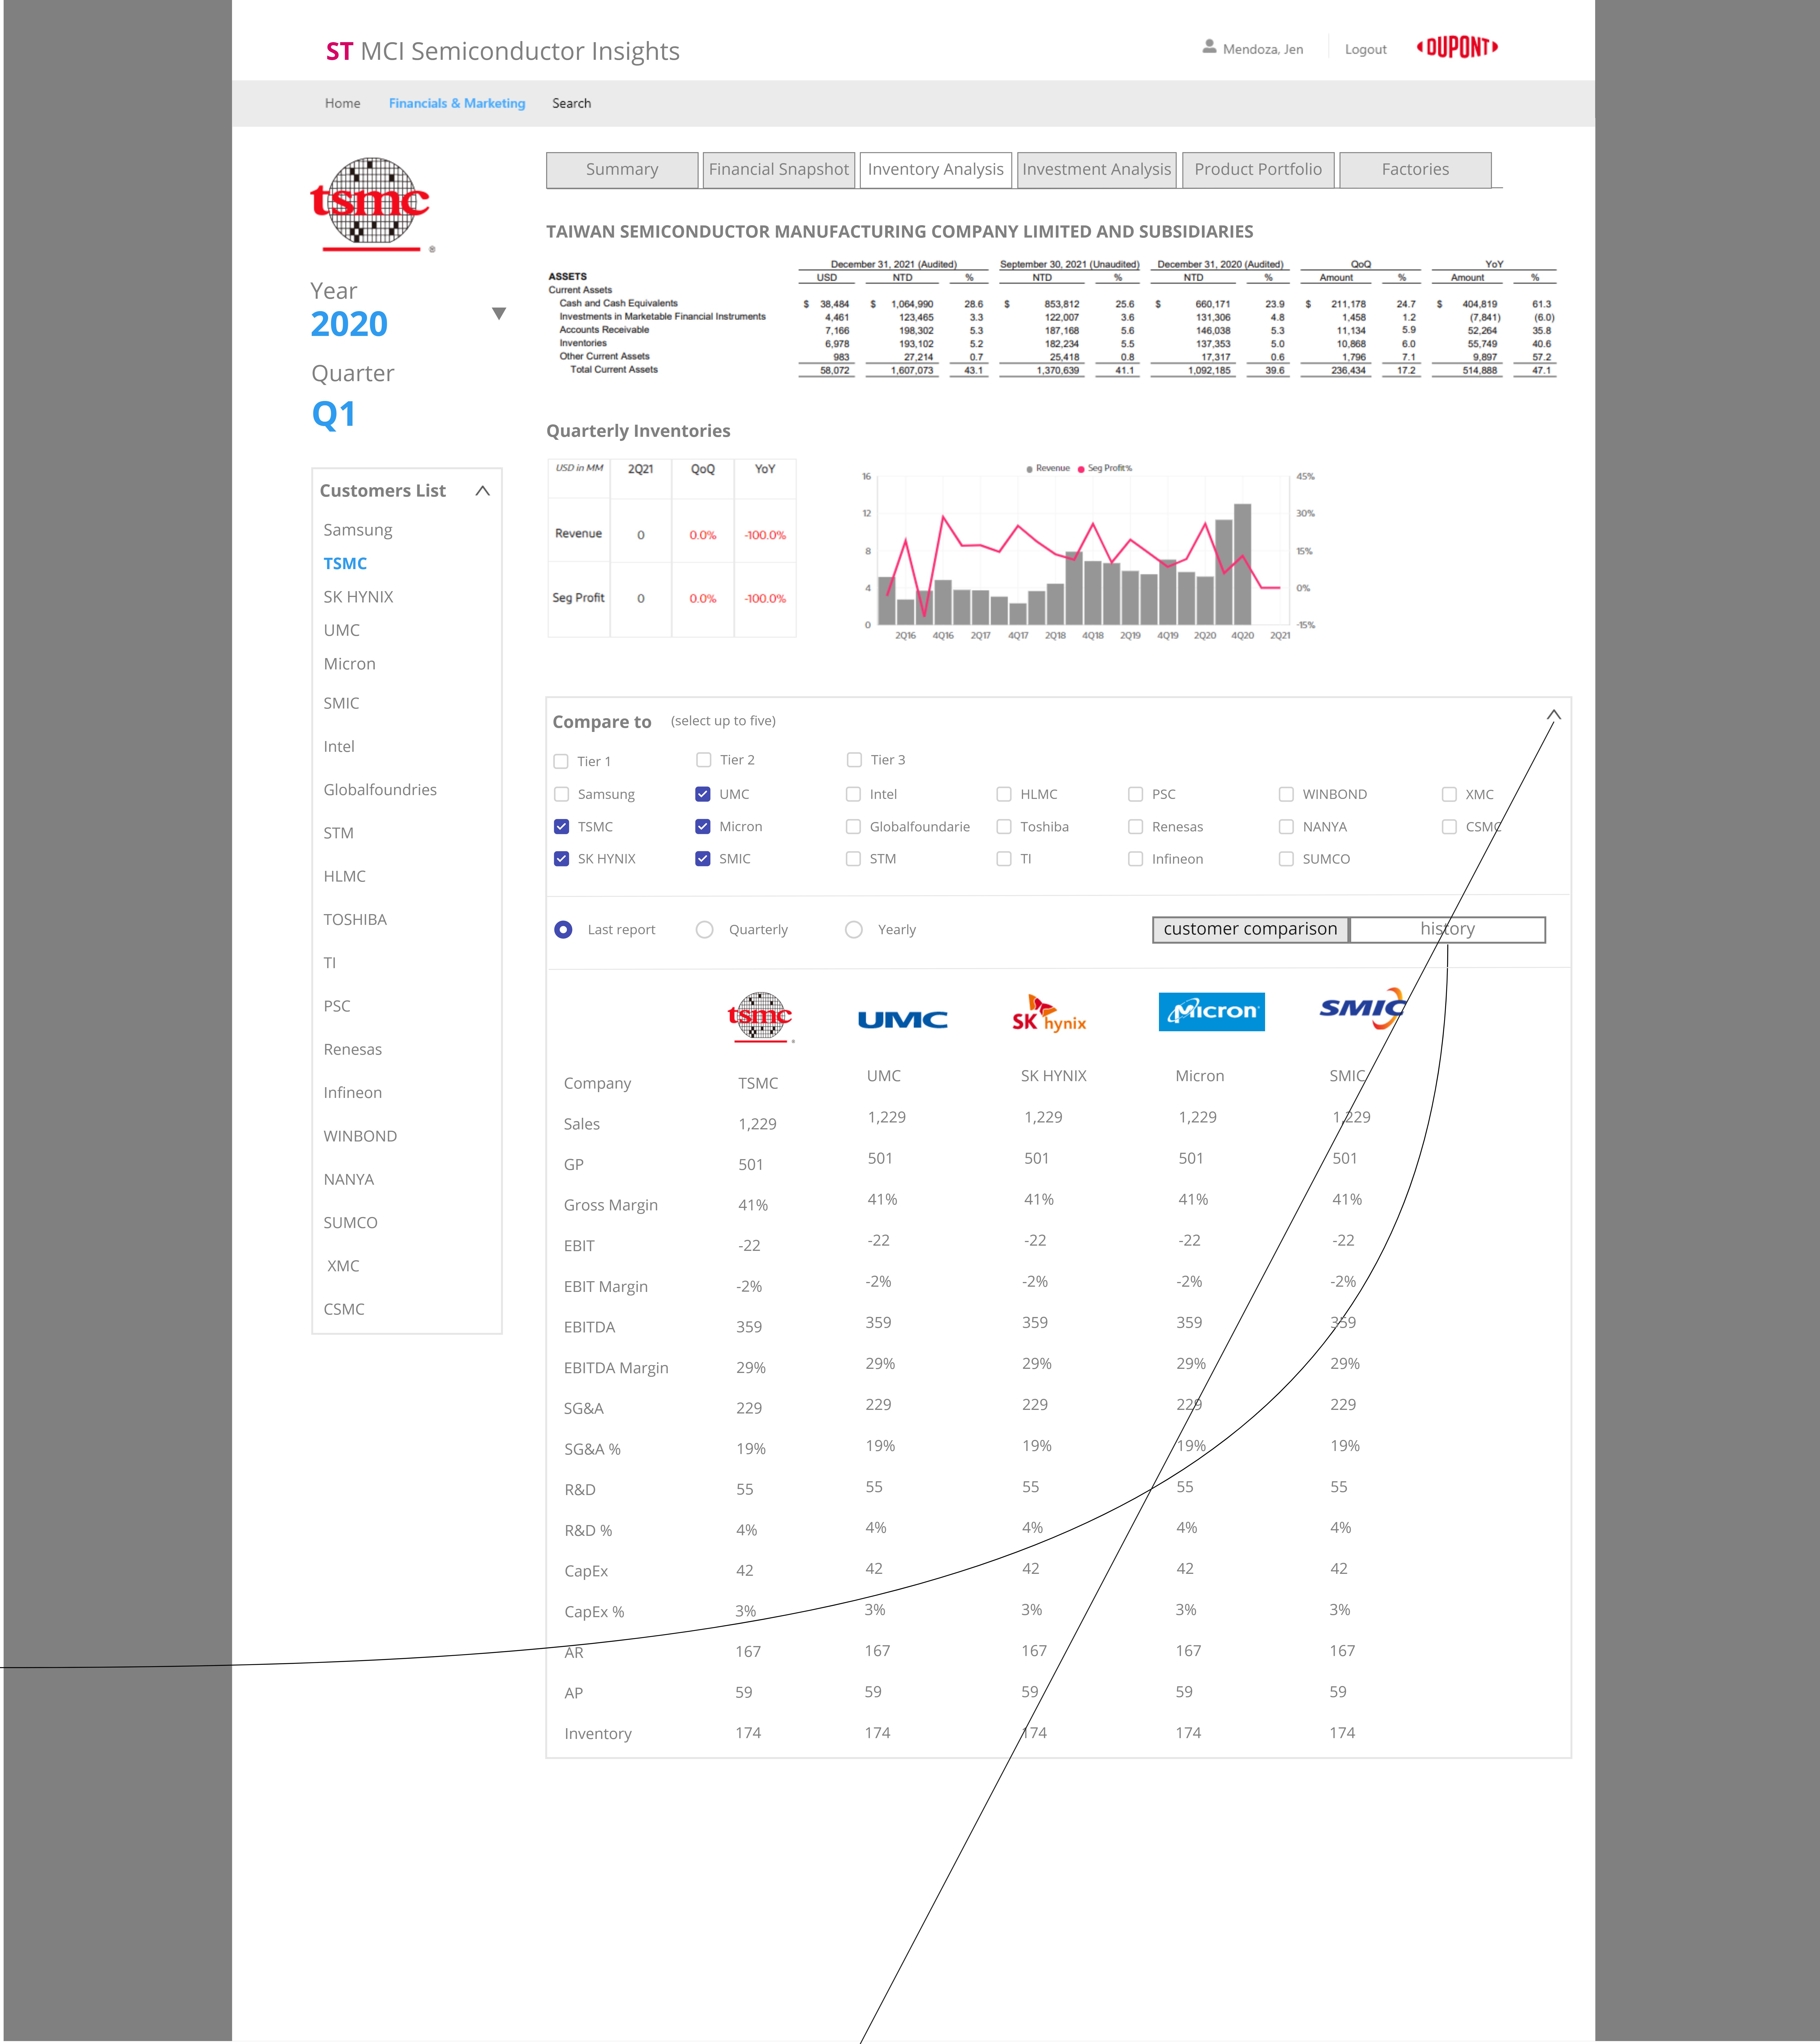
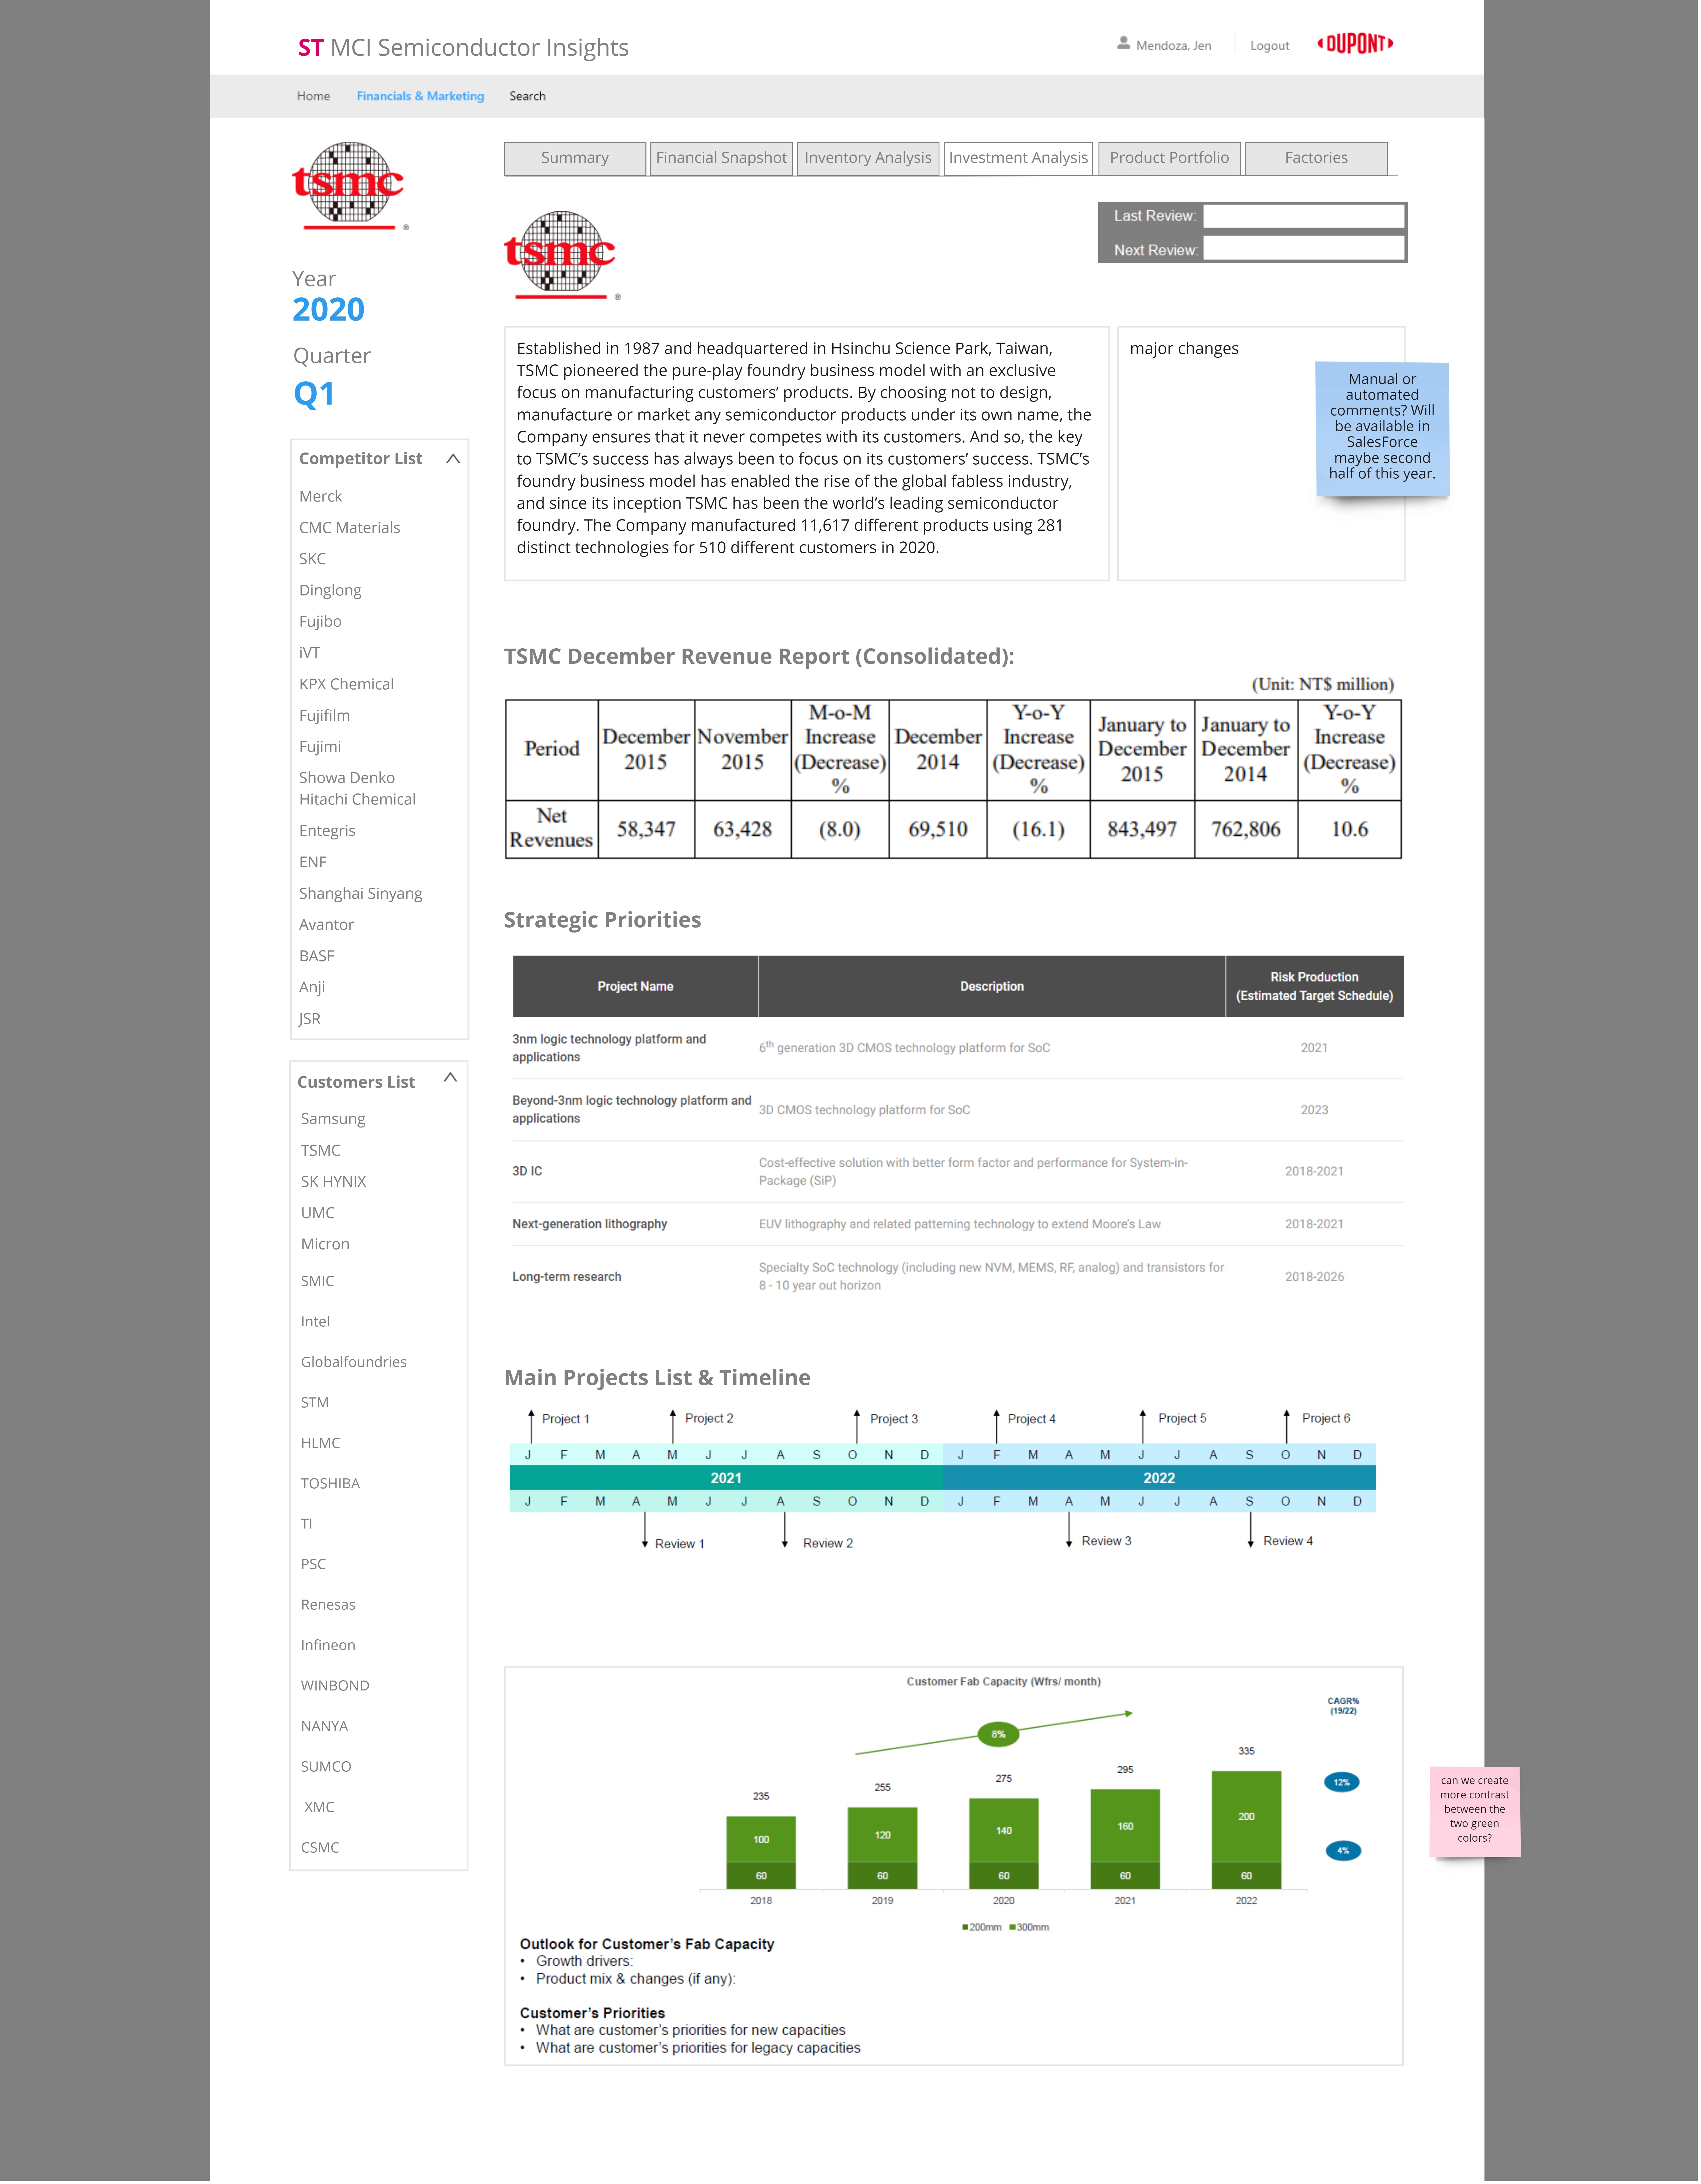
Showing the various trend lines, users would be able to make better business decisions on how to allocate resources. We also determined that we needed to add increased functionality to this system, so that the users could export the data sets into documents that they could present to other stakeholders and business leaders.
Test: Validation, Usability, Feedback
Project was put on hold due to shifting business priorities. Never got out of initial planning and wireframing stages.